Graphic Post-processing
Introduction
This is an example of how to do your own graphics post-processing using the Mixing Pipe example.
Run baramFlow and open its folder.
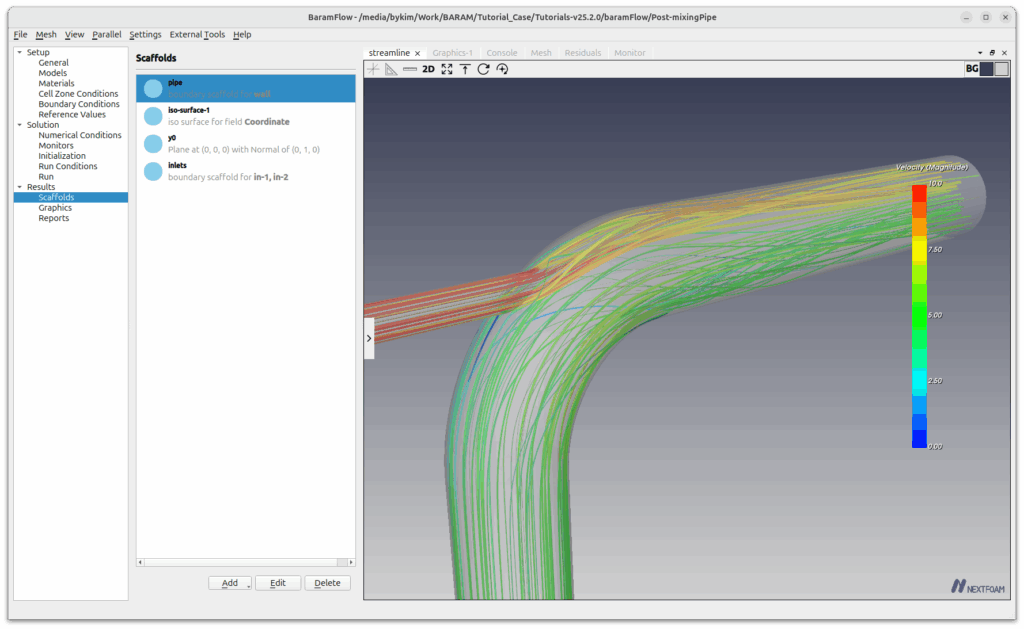
Scaffolds
A scaffold is originally a scaffolding on a construction site, but in software it refers to a basic structure or template. In Baram, it’s an object that you set up in advance to determine what you want to draw.
Once you’ve created the scaffolds you need, you can make various settings for the drawing in Graphics.
Let’s create the following four scaffolds
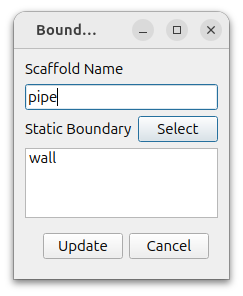
pipe surface
Select [Scaffold] and press [Add] at the bottom to select [Boundary].
Click [Select] and in the window that appears, rename it to pipe and select wall. Click [Update] to create the scaffold named pipe.
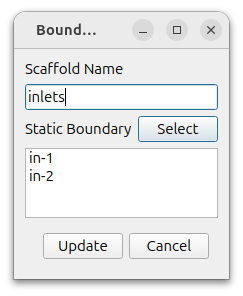
inlet surfaces
Press [Add] again to select [Boundary].
In the window that appears after pressing [Select], rename it to inlets and select in-1 and in-2. Click [Update] to create the scaffold named inlets.
y0 plane
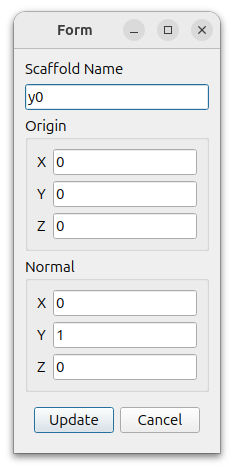
Press [Add] again to select [Plane]. We will create a plane with y=0.
Rename it y0 and enter (0 0 0) for Origin and (0 1 0) for Normal. Click [Update] to create a scaffold called y0.
iso-surface
Press [Add] again to select [Iso-Surface]. We will create four planes with z coordinates of 0, 1, 2, and 3.
For [Surface of Constant], select [Coordinate] and [Z Component].
Enter 0 for [Iso-Values], 4 for [Surface per Value], and 1 for [Spacing]. This creates a surface with z = 0 and faces 2, 3, and 4 with z = 1 plus the 1 given for spacing.
Clicking [Update] creates a scaffold called iso-surface-1.

Graphics
Graphics refers to a separate window for drawing.
Draw a Velocity Distribution on a Plane
Draw the velocity distribution in the cross section with y=0 and z = 0, 1, 2, 3.
In the window that appears after clicking [Add], you can select the scaffolds you have created by clicking the [Select] button at the bottom. Select pipe, y0, and iso-surface-1.
Rename them to velocity.
For [Time], you can choose from the saved data. Use the last time, which is the default.
[Color by] determines which scalar value should be used to color the figure. Select Velocity.
[Vectors determines which vector values to use and the size of the vector. For Scale, enter 0.02.
[Streamlines determines the length and style of the streamlines.
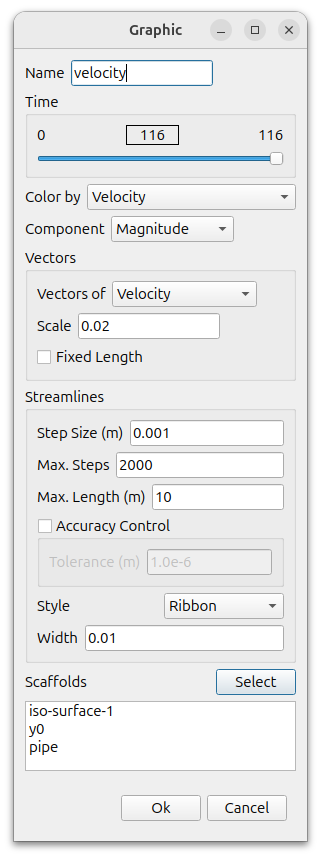
Click [OK] to create a new window with a graphic called velocity.
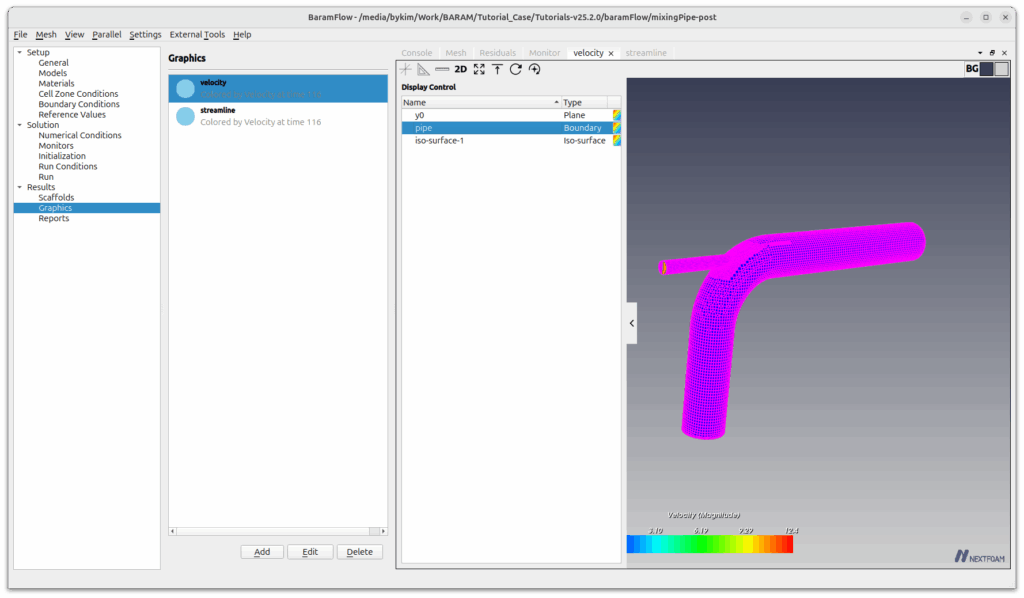
Velocity distributions for three scaffolds are plotted: pipe, y0, and iso-surface-1. Each scaffold can be detailed with the right mouse button or in the collapsed window. The detailed settings are the same as in the graphics window of baramMesh and include the following items
- Hide/Show
- Opacity
- Color : when Color mode is Solid
- Color Mode : Select Solid or Field
- Display Mode : Select Wireframe or Surface or Surface with Edges
- Cull Front Face : Make the front side invisible so you can see the hidden side
- Show Vectors
- Show Streamlines
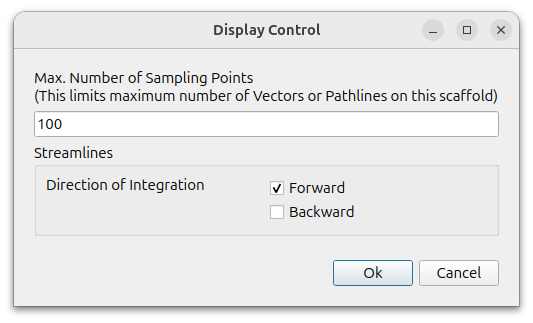
- More… : When drawing a vector or streamline, set the maximum number of sampling points and the direction of the streamline.
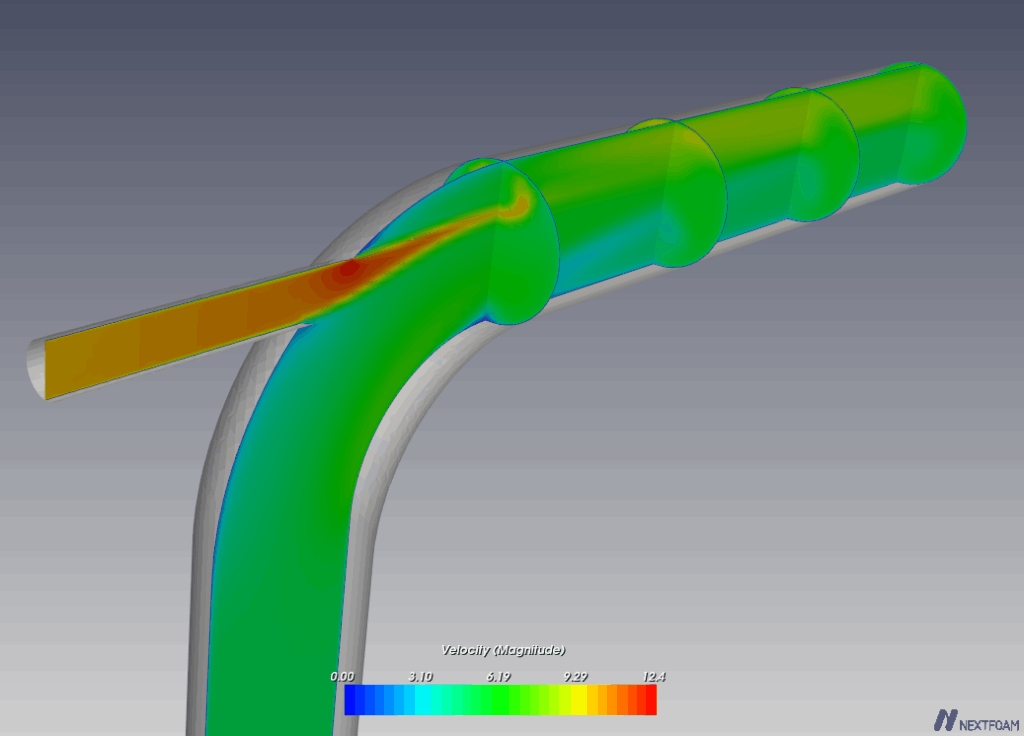
Select the pipe, enable [Cull Front Face], and change the [Color Mode] to Solid, and you should see the following image.
Colormap lengend Setup
Double-click the color map to bring up the settings window, shown in the following image.
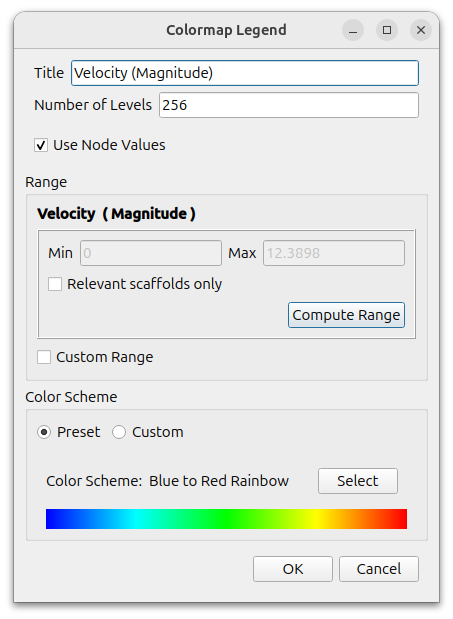
- Number of Levels
- Use Node Values : Disable it to show cell value
- Range
- Relavant scaffolds only : When there are multiple scaffolds and some are set to be invisible (Hide), choose whether to determine the minimum/maximum based on what is visible only or whether to determine the range based on what is invisible as well. If the option is on, only visible is used to determine the minimum/maximum.
- Custom Range : Selecting this option allows you to enter min/max values directly
- Color Scheme : You can select by pressing [Select]. If you select [Custom], you can select the minimum/maximum color.
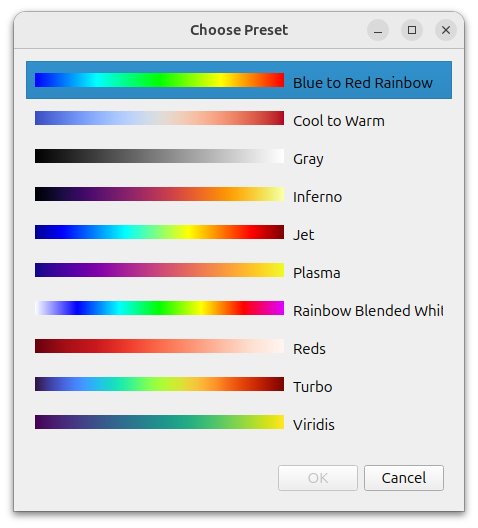
If you select Jet in the Color Scheme and adjust the position and size of the color map legend with the mouse, you should get something like this
Vector plot
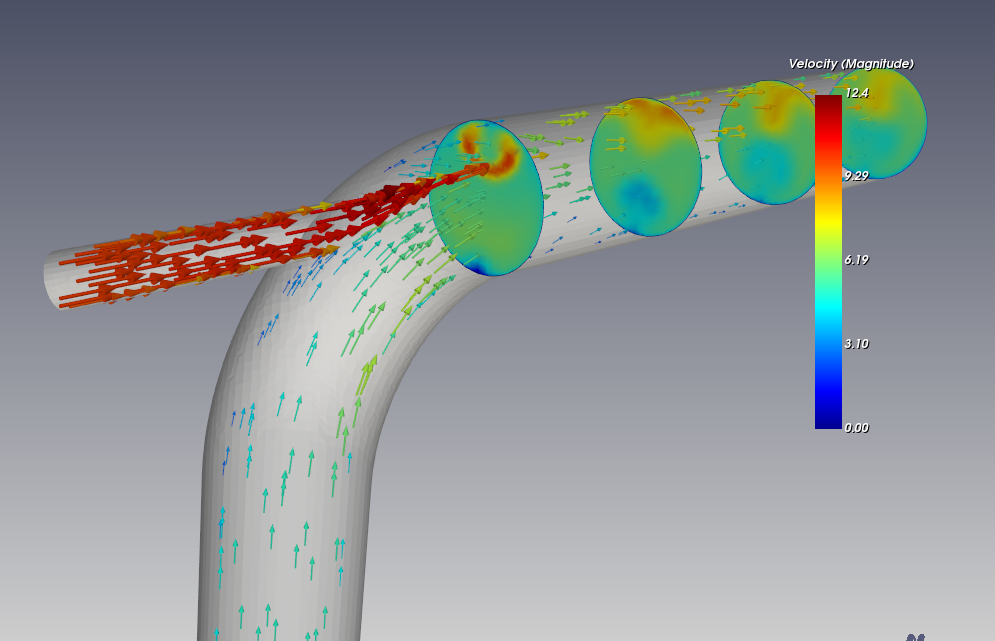
To draw a vector on a plane with y=0, set it up like this
- Select y0
- Select [Show Vectors]
- Change it to [Hide].
- In the [More…] window, change [Max. Number of Sampling Points] to 500
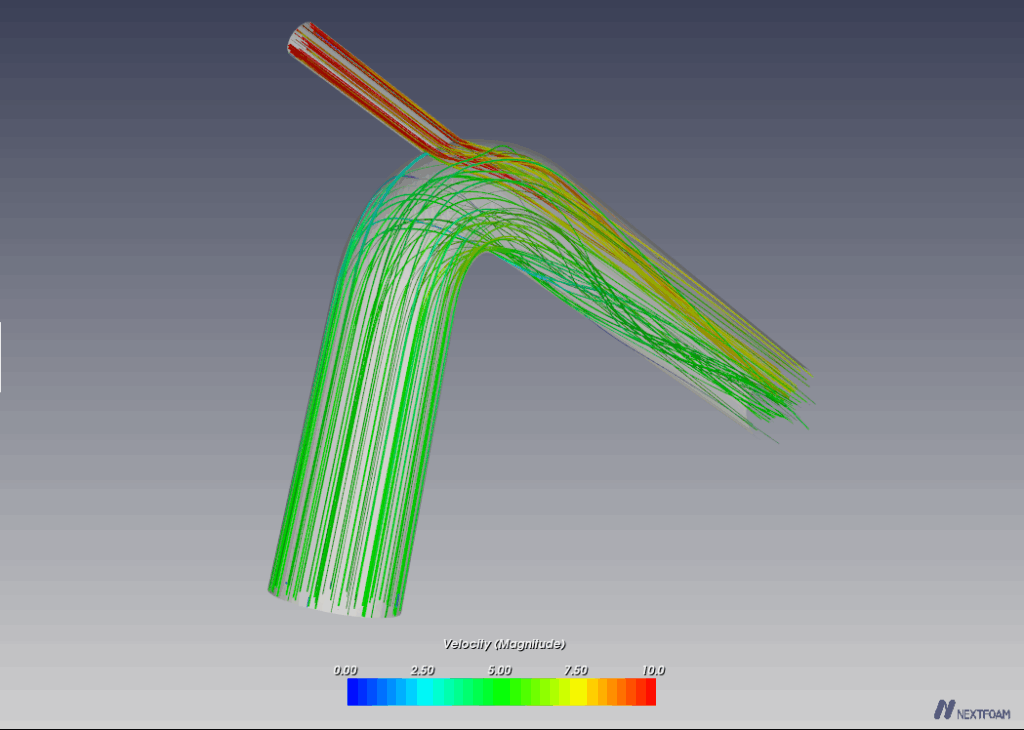
Draw Streamline
Press [Add] to create a new graphic.
Press the [Select] button at the bottom to select the pipe and inlets scaffold.
Rename them to streamline.
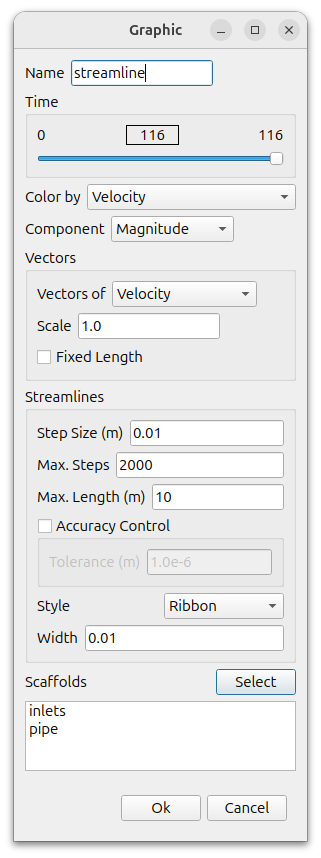
In Streamlines, change the Step Size to 0.01 and the Max. Length to 10.
Click [OK] to create a graphic called streamline and a new window will be created.
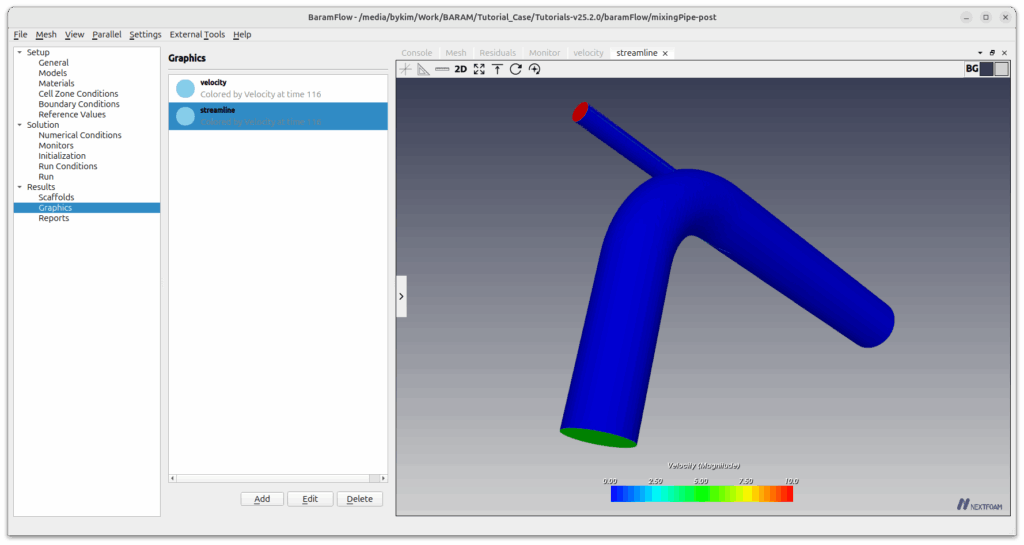
Select the pipe, enable [Cull Front Face], and change the [Color Mode] to Solid.
Since we don’t need to see the borders of the inlets, we set them to Hide and enable [Show Streamlines] to get the following image.