Graphics
Graphics is a separate window that uses a scaffold to post-process the calculation results.
When you create a graphics by pressing the [Add] button on the screen, the following window appears. After making the desired settings, a new graphics window will be created.
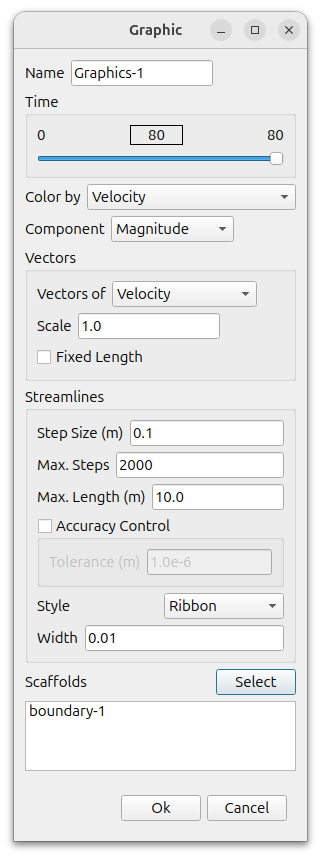
Name
Write a name of your choice.
Time
Select which of the stored data you want to display.
Color by
You can select the calculated and stored values of velocity, pressure, temperature, density, Mach number, turbulence kinetic energy, turbulence dissipation rate, etc. And also coordinates can by selected. Q, total pressure, vorticity, wall heat fluxt, wall shear stress, y+, air age, heat transfer coefficient, etc. that are not stored will create and display fields directly if not already created in [Report] – [Collateral Field].
Vector
- Vectors of : You can choose from velocity, coordinates, vorticity, and wall shear stress
- Scale : Determines the size of the vector.
- Fixed Length : The size of the vector is determined by the value of the vector field, which can be fixed with this option.
Streamlines
Step Size, Max. Steps, and Max. Length can be set.
The accuracy can be adjusted using the Tolerance for the tongue.
For Style, you can select ribbons and lines and specify their thickness.
Scaffolds
Select the Scaffolds to display.
Graphic Options
Graphic options can be set for each of the scaffolds included in the graphic.
Each scaffold can be selected in the collapsed window or directly with the left mouse button. Selected ones are marked with a red wireframe.
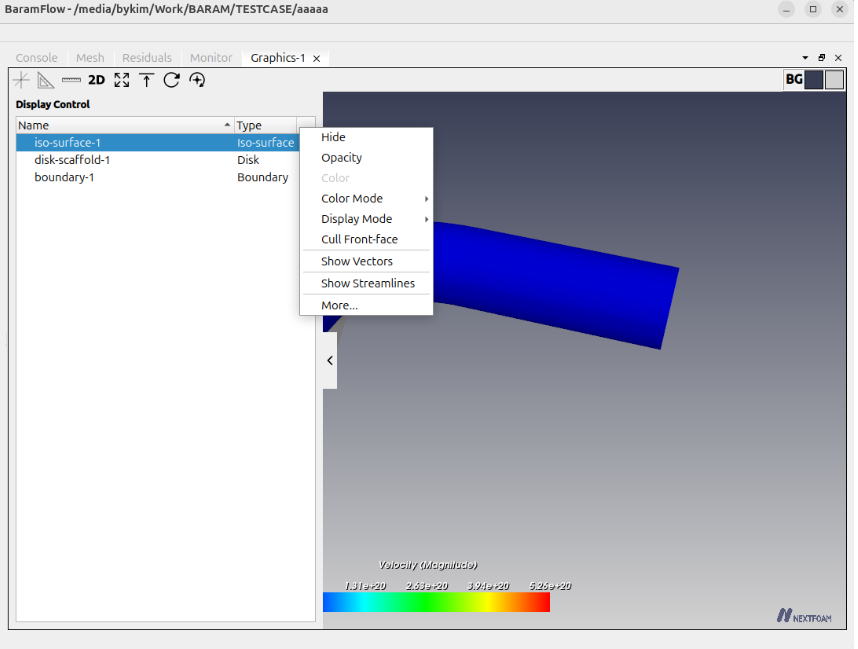
Graphical options include the following
Hide/Show
Graphics options can hide or show each of the following scaffolds
Opacity
Adjusts the transparency of each scaffold.
Color mode
The color is displayed based on the value of the Field, which can be displayed as a solid color.
Color
Select a color when the Color mode is Solid.
Display Mode
You can choose between Wireframe, Surface, or Surface with Edges.
Cull/Reveal Front face
This option makes the front face invisible when multiple objects are overlapped, allowing you to see the inside.
Show/Hide Vectors
Vectors are invisible by default and can be shown or hidden using this option.
Show/Hide Streamlines
Streamlines are invisible by default and can be shown or hidden using this option.
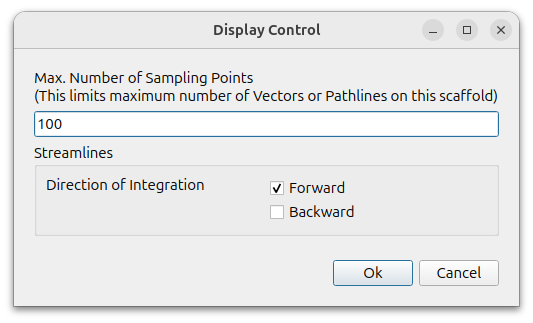
More
When drawing vectors and streamlines, too many sampling points can be very time-consuming and unsightly, so you can limit the maximum number.
You can choose the direction of the streamline. You can select either Forward or Backward, or both.