Cavitation analysis case
Cavitation is a phenomenon in which a phase change occurs within a fluid due to pressure changes caused by changes in fluid velocity. In incompressible flow, as the liquid velocity increases, the pressure decreases. When the pressure falls below the saturated vapor pressure, vapor bubbles form within the liquid. Cavitation is most common in pipe flow areas where the flow velocity changes significantly, such as nozzles and valves, or around moving objects such as pumps and propellers. Because these bubbles generate noise and vibration when they dissipate, and can cause erosion when they collide with walls, the numerical simulation of cavitation has attracted significant attention across various fields.
When analyzing cavitation phenomena using computational fluid dynamics, the same governing equations and numerical analysis algorithms are used as for single-phase flow analysis. To account for the effects of phase change, equations for mass fractions must be added, along with accounting for changes in mass and material properties, the influence of gravity, and the gas-liquid interface.
NextFOAM developed and released NextFOAM to improve OpenFOAM’s performance in single-phase incompressible flow and heat transfer analysis. Based on NextFOAM’s algorithms and libraries, the team developed a solver capable of simulating both steady-state and unsteady cavitation phenomena. OpenFOAM provides Kunz, Merkle, and Schnerr-Sauer phase-change models, and the Zwart model was added. Cavitation solvers are less stable than single-phase flow due to the phase change and resulting rapid pressure changes. To address this issue, the team prevented phase change from occurring until the flow stabilized, allowing cavitation to occur gradually at the beginning of the calculation.
Here are some examples of cavitation analysis performed at NEXTFOAM.
NACA66 Hydrofoil
To validate NEXTFOAM’s cavitation solver, we performed analyses on a NACA66 hydrofoil.
The solver was validated by comparing it with the experimental results of Shen and Dimotakis (
The influence of surface cavitation on hydrodynamic forces, 1989 ).
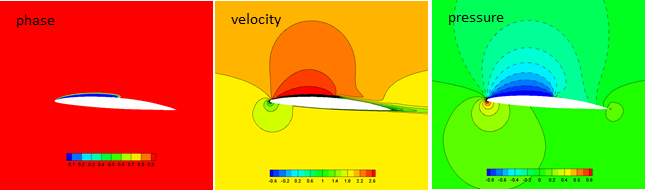
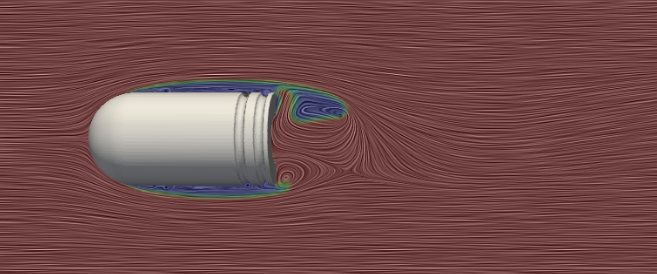
Phase, velocity, pressure of NACA66 hydrofoil
The figure above shows the results of cavitation, velocity, and pressure. The grid is a two-dimensional ordered H-type grid with 27,000 grid elements. The angle of attack is 4 degrees, the flow velocity is 2.01 m/s, and the cavitation number is 0.84. The Schnerr-Sauer model was used as the phase change model. The figure below shows the results of the k-epsilon, k-omega, and Spalar-Allmaras turbulence models. The standard k-epsilon model shows the closest match to the experiment.
This problem is posted on the BARAM homepage as a tutorial. Page link
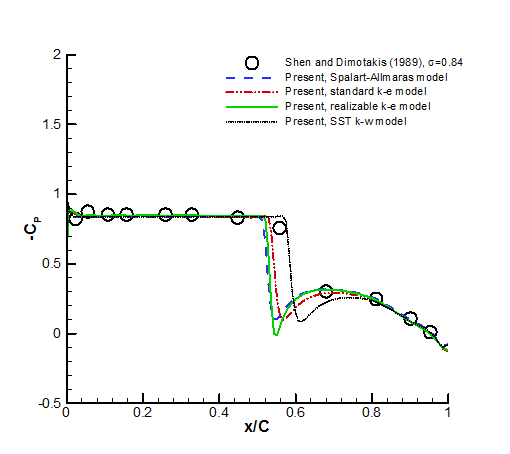
Results according to turbulence model
Axial flow pump
The figure below illustrates an analysis example of a single-stage axial-flow pump consisting of an impeller and a stator. The rotation of the impeller was controlled using the steady-state MRF method and the unsteady-state sliding mesh technique.

Axial pump geometry and results
In pumps, cavitation simulation can be used to design a shape that can suppress cavity formation, or NPSH can be predicted by analyzing the head change caused by cavity formation according to changes in inlet pressure.
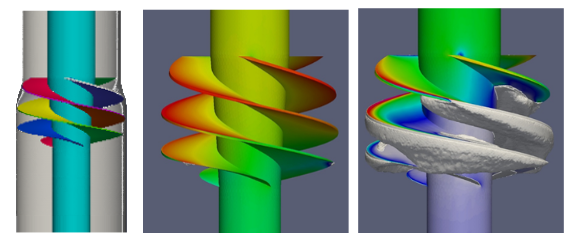
Post-processing of turbomachinery such as pumps can be done using turboPost. Oliver Borm released a set of Python scripts for efficient post-processing of turbomachinery using VTK and ParaView. ( https://sourceforge.net/projects/turbopost/ ) Using this, you can check the flow fields of a specific meridian plane in the spanwise direction of the impeller and the average of the flow fields in the picthwise direction.

turboPost post-processing example: spanwise plane density (left), pitchwise average temperature (right)
Turbo pump
Liquid-fueled rockets use turbopumps to supply fuel and oxidizer to the combustor. Typically, the pressure in the fuel and oxidizer tanks used in rockets is kept relatively low. However, the turbopump impeller rotates very quickly, creating favorable conditions for cavitation. To prevent system malfunctions caused by cavitation in the turbopump impeller, an inducer is installed at the impeller inlet to increase the pressure of the incoming fluid. The figure below illustrates an analysis example of a turbopump inducer for a space launch vehicle.
Turbo pump geometry, pressure, cavity
Plunger pump
Plunger pumps utilize the pressure differential generated by the reciprocating motion of a plunger to suction and discharge liquid. They are widely used to transport high-pressure liquids. As the plunger reciprocates, the discharge port opens and closes, significantly narrowing the area of the discharge port. This increases velocity and causes cavitation. Furthermore, the gap between the cylinder and plunger can cause cavitation even when the discharge port is closed.
The figures below illustrate an analysis example of a plunger pump. A gap of 10 microns to 30 microns between the cylinder and plunger was modeled, and the plunger motion was simulated using a layering technique. The plunger velocity and inlet/outlet pressures were input from the system analysis results file. It can be confirmed that new cavitation occurs when the discharge port is completely closed.
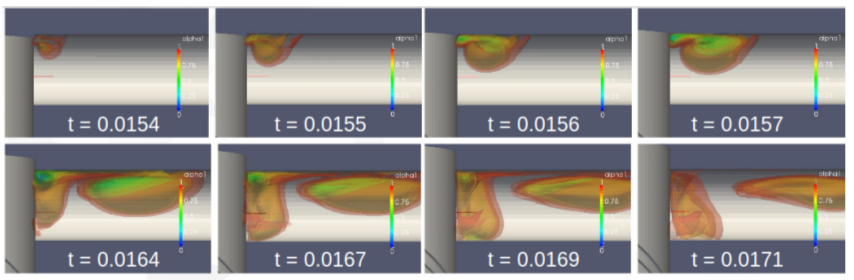
Cavity distribution inside the plunger pump
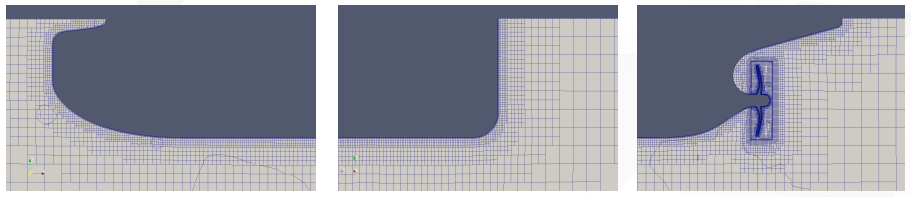
Fluid form just before the port opens
Super-cavitation
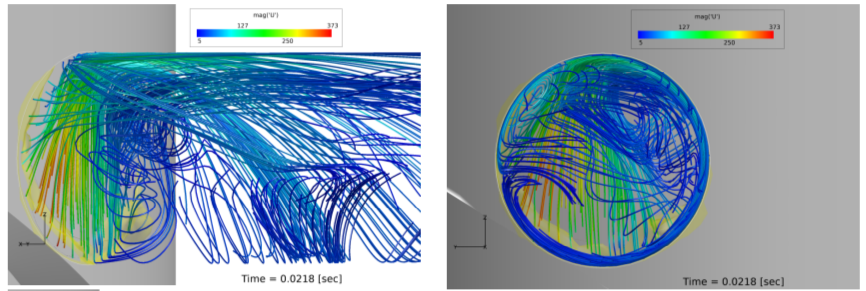
We simulated the control panel deployment of an underwater vehicle in a supercavitation state. We developed a cavitation model that includes non-condensable gas (exhaust gas) and a solver that utilizes a dynamic grid. The dynamic grid implements the control panel rotation using a layering technique.
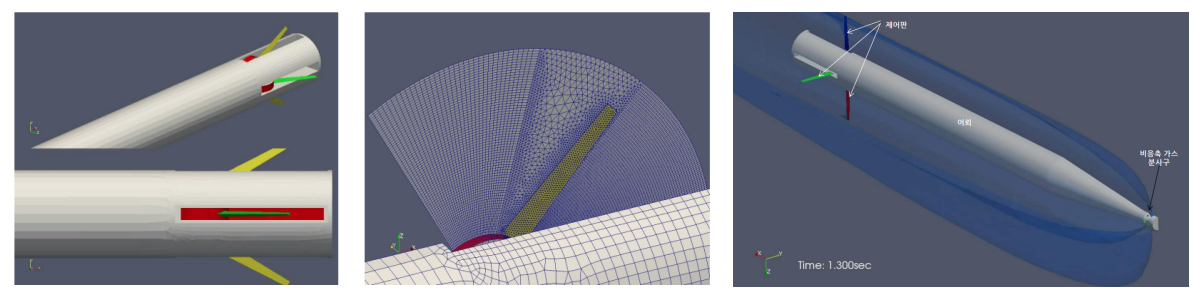
Geometry, Mesh Structure for Dynamic Mesh, Computational Results
Marine propeller cavitation
Cavitation analysis was performed on a problem involving a hull, propeller, and rudder. After developing the flow around the hull using steady MRF calculations, unsteady cavitation around the propeller was calculated using a sliding mesh.
The mesh was created using snappyHexMesh. The Schnerr-Sauer cavitation model was used, and the realizable ke turbulence model was used. The cavity geometry was similar to experimental and commercial code results. The time-dependent surface pressure of the propeller was input into the BEM noise analysis code.
Grid around the hull and propeller
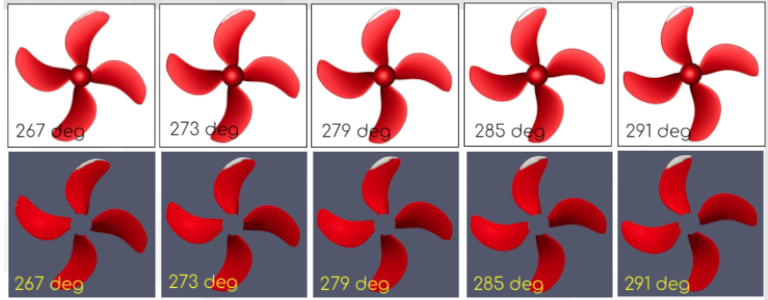
Cavity distribution around the propeller