Automation of CFD preprocessing and pollutant diffusion simulation using digital topography
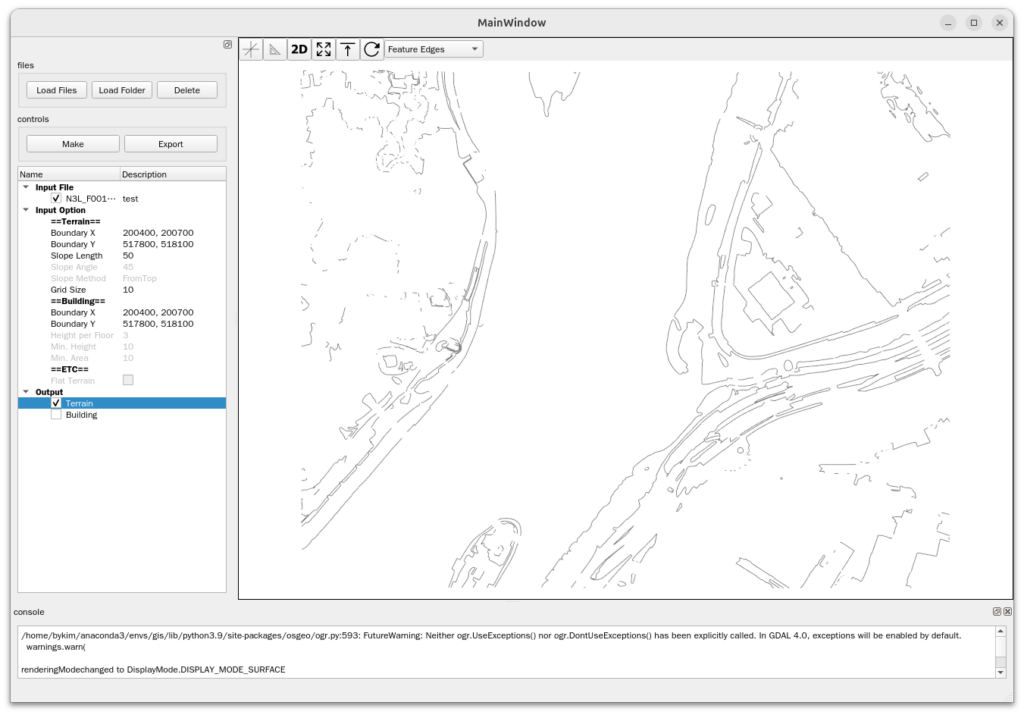
To analyze contaminant diffusion using computational fluid dynamics (CFD), we automated the preprocessing process, which involves generating geometry and meshes using digital topographic maps. All processes were performed using open-source software, and analysis examples using the developed software are presented.
The preprocessing process consists of the steps of loading shape information, creating and processing shapes, and creating meshes.
- Geometry Information: The digital topographic maps provided by the National Geographic Information Institute (NGI) in API format follow the standard format of a Geographic Information System (GIS). OsGeo, a Python library for the open-source QGIS program, is used to extract and process geometry information from GIS-formatted data.
- Shape Creation and Processing: Includes the ability to load 3D data containing target shapes, perform Boolean operations between shapes, and export shapes to a grid generation program.
- Mesh Generation: Mesh is generated using snappyHexMesh, a mesh generation utility from the open source program OpenFOAM.
If you would like to use a shape generation program using digital topography or are interested in a CFD analysis program, please contact marketing@nextfoam.co.kr.
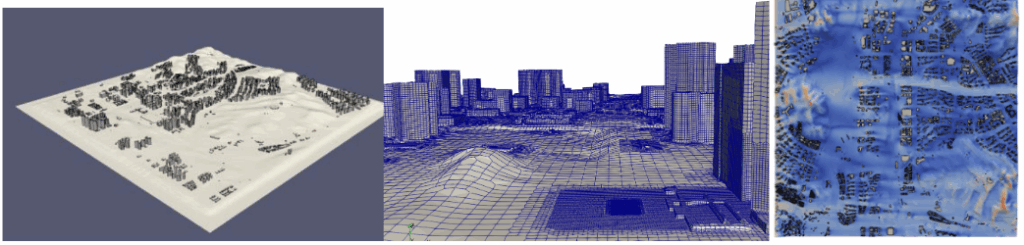
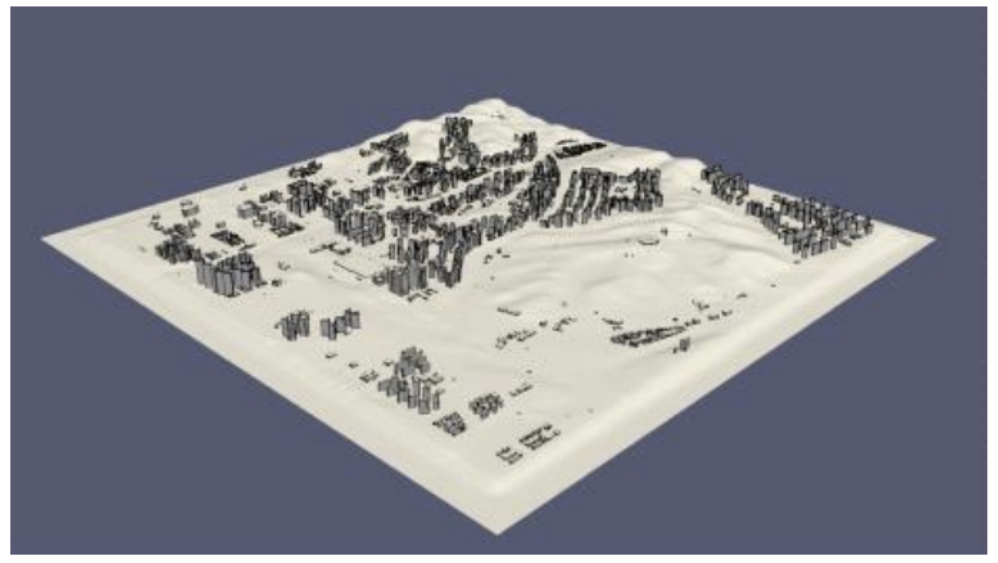
Terrain geometry generation
The following steps are taken to create a 3D surface grid from a continuous digital topographic map.
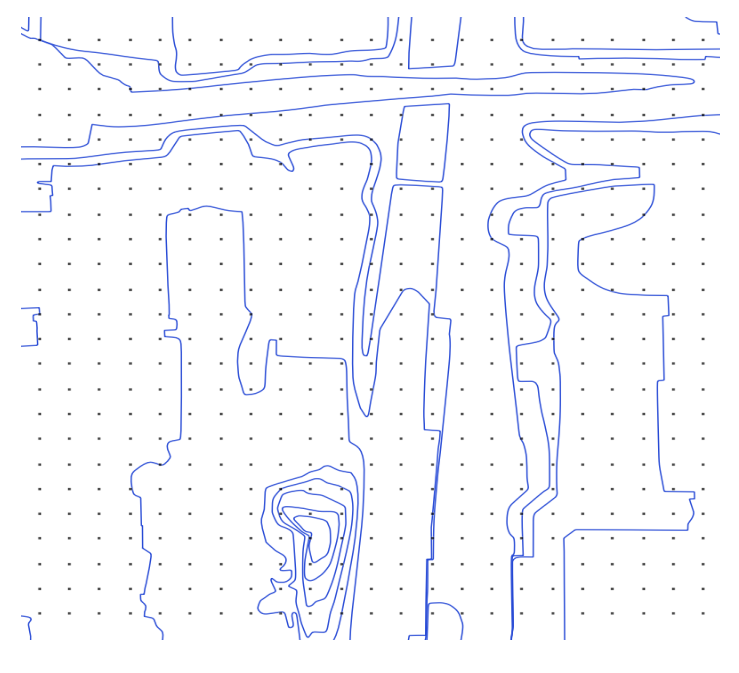
- Loading contour data
- Use the continuous digital topographic map provided by the National Geographic Information Institute.
- Obtain information by reading the F10000.shp file
- Convert to Python object using OsGeo
- Information point extraction
- Extracting the location and height values of contour points stored in the form of multi-line strings in a combustion numerical topographic map
- Height calculation using linear interpolation
- Define new points to represent the entire terrain using the extracted points.
- What’s new is that it’s generated in the form of an x, y-direction aligned grid with an interval that the user arbitrarily sets.
- The height value of the newly created grid point is calculated by two-dimensional linear interpolation from the surrounding contour points.
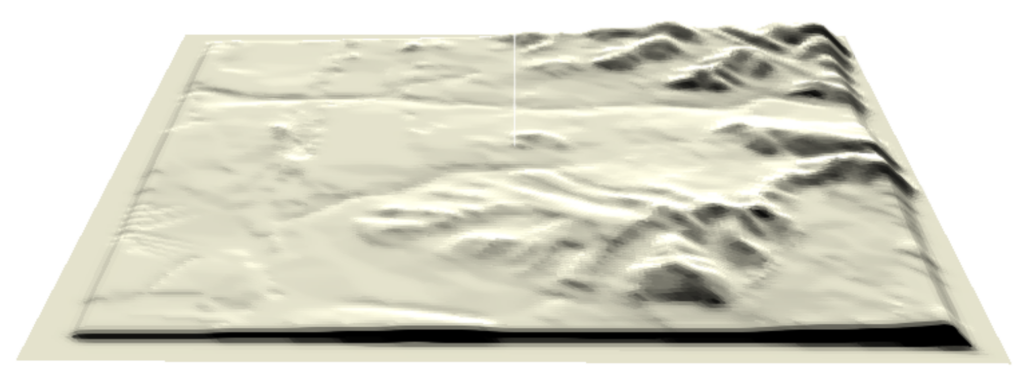
- Height correction
- Move so that the z-coordinate of the lowest altitude becomes 0
- Move the terrain so that the z value gradually decreases before the end of the terrain reaches the boundary.
- Create a surface grid
- Convert grid points to surface grid using the vtk library (STL or OBJ format)
- Additional corrections
- Includes the latest changes not reflected in the digital topographic map or civil engineering works scheduled for the future.
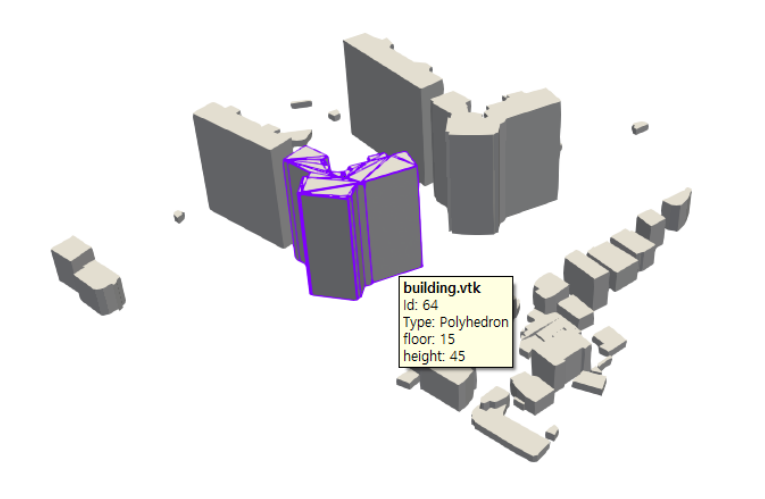
Creating building geometry
You can import the building’s plan data from a digital topographic map to create a 3D shape and check the building’s information using the building’s metadata.
It proceeds through the following steps:
- Importing building plans – Converting building information from the B0010000.shp file of the continuous digital topographic map into a Python object.
- Extract building floor information
- Extract surface data representing the building’s floor plan
- Extract the coordinates of each point
- Create points, lines, and surfaces using the OpenCaseCade library.
- Create a 3D shape by extruding the surface to a certain height
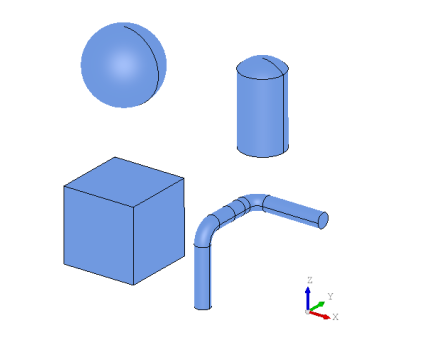
Create additional structures
You can add models of large structures, such as tanks and large pipes, that are not included in the digital topographic map but are necessary for modeling, as well as geometric models of pollutant leak sources. You can create models of spheres, cylinders, cubes, and pipes.
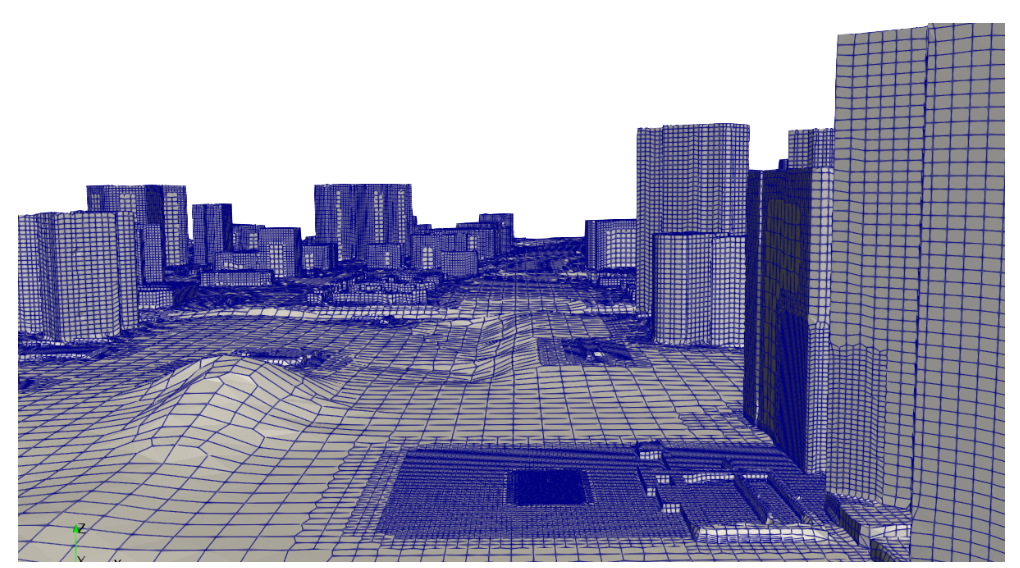
Mesh generation
The entire computational domain is constructed as a hexahedral dynamic mesh using the blockMesh utility of the open-source program OpenFOAM.
3D meshes, including terrain and structures, are automatically generated with minimal user input using snappyHexMesh, OpenFOAM’s mesh generation utility.
Case study of contaminant diffusion analysis
The numerical analysis method for simulation is as follows:
- Atmospheric conditions
- Development of Pasquill class waiting conditions
- Considering atmospheric stability due to surface heat radiation and atmospheric temperature difference
- Setting the velocity and turbulence (U, k, epsilon) distribution at the inlet boundary
- solver
- Pressure-based heat and fluid analysis solver developed by Nextform
- buoyantSimpleNFoam, buoyantPimpleNFoam
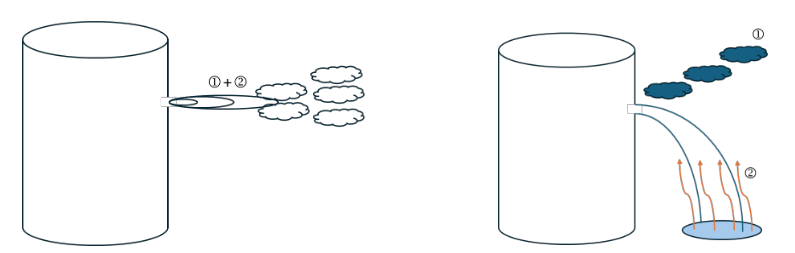
- Accident scenarios and source terms
- Mass source: Use two types of sources: jet source and pool source, depending on the interpretation scenario.
- momentum source: expressed as a function of velocity over time
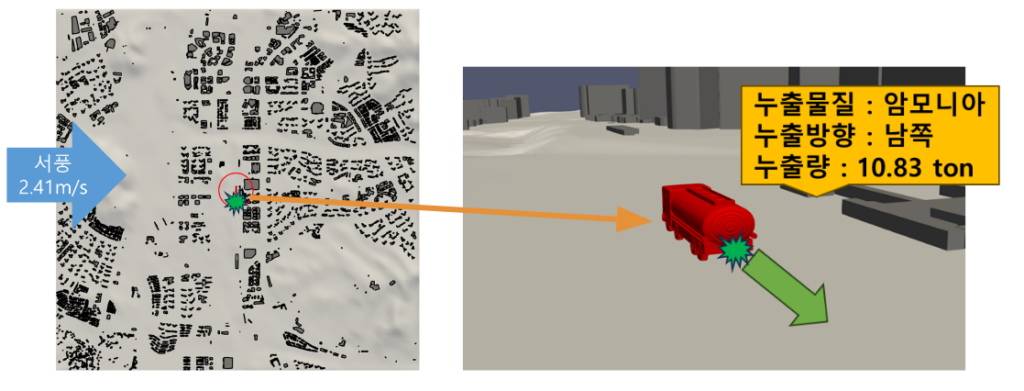
The calculation conditions are as follows:
- Atmospheric stability: Pasquill class D
- Wind direction and speed: West wind 2.41 m/s at 10 m above sea level
- Atmospheric temperature: 25’C
- Source of contamination: Ammonia leak, totaling 10.83 tons
- Scenario configuration based on combinations of leak amount, leak rate, leak time, and leak type (gas leak or simultaneous gas and liquid leak)
- Gas leaks only consider jet ejection
- Simultaneous gas and liquid leakage is considered up to jet and pool evaporation (pool evaporation is calculated by calculating the surface area of the liquid layer that changes over time to calculate the evaporation rate and evaporation amount per hour).
The simulation results are as follows.
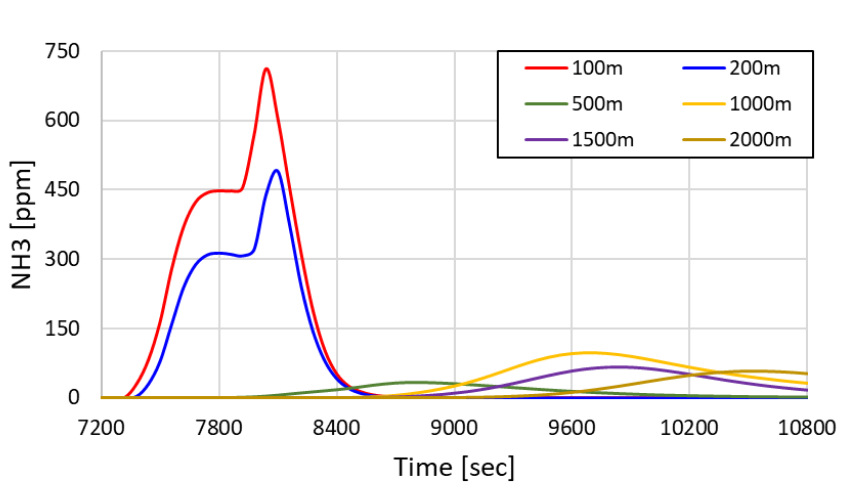
We developed an automated system for precise contaminant diffusion simulation using CFD. Using digital topographic maps from the National Geographic Information Institute, we automated the modeling and simulation of terrain and building geometry and grids. This system enables easy and accurate simulations even for non-CFD experts.